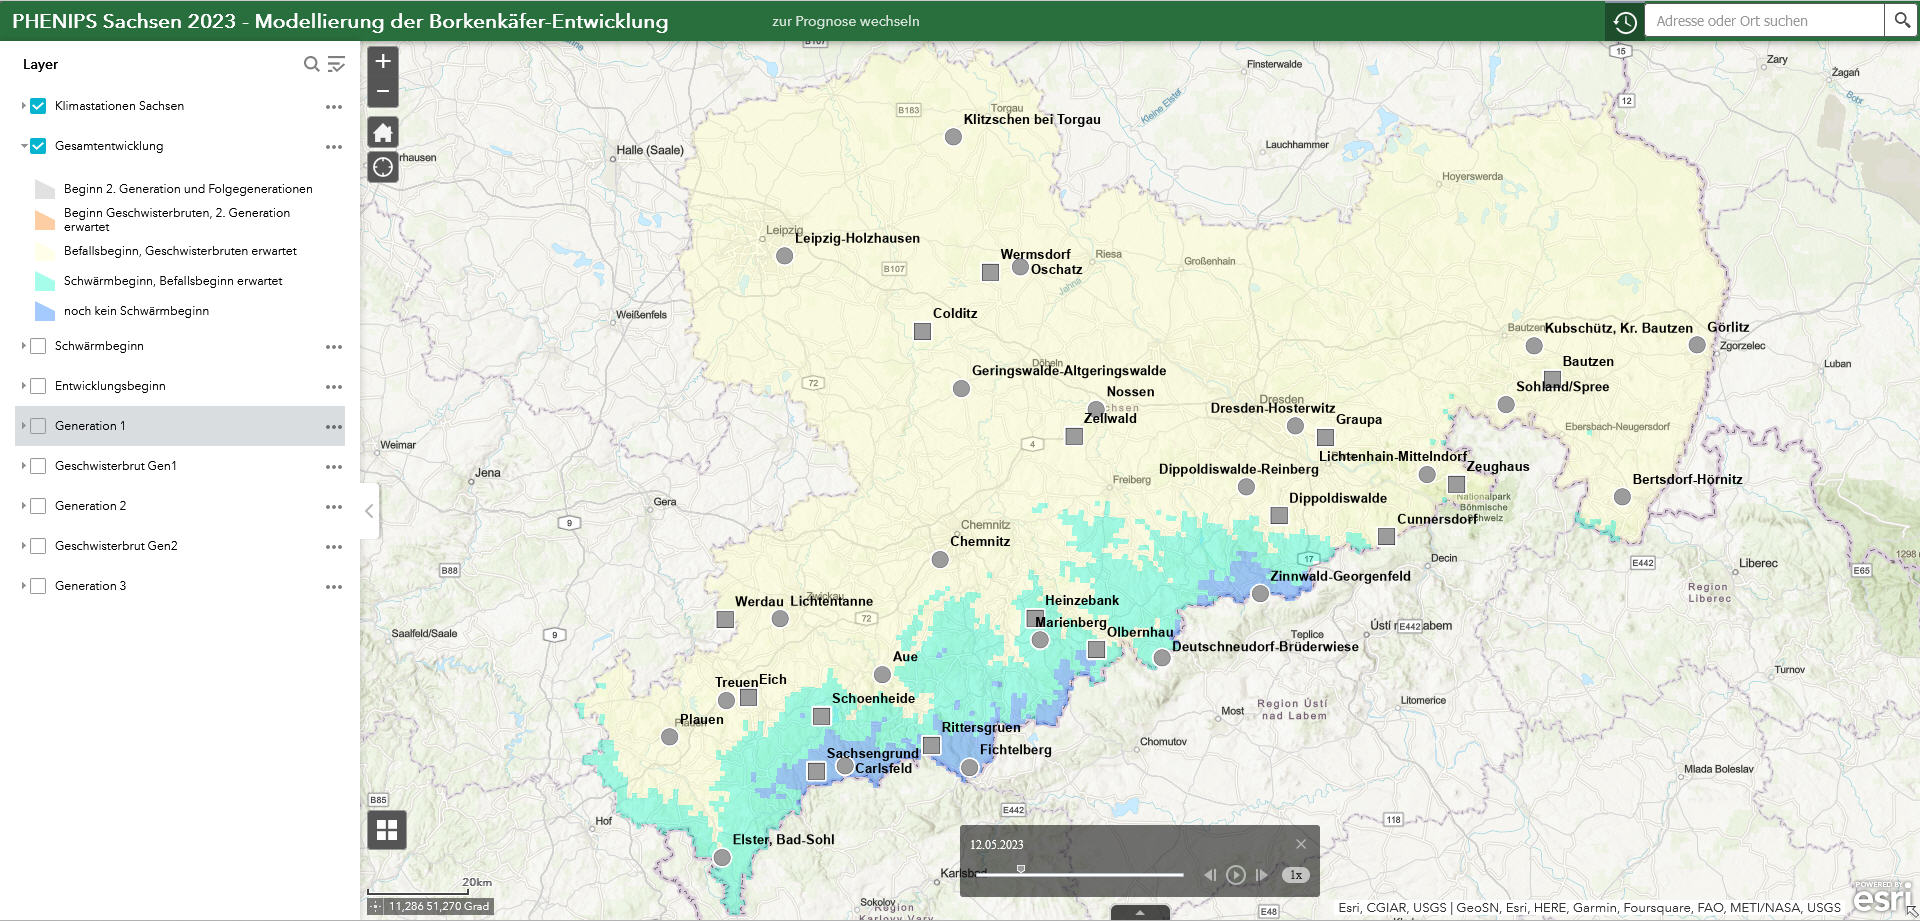
The area representation of the phenology and development of the spruce bark beetle, based on the DWD raster data for Saxony, can be accessed for the respective season using map services. In these services, the different data layers can be selected from the displayed layer list. When the map service is called up, the “Saxony climate stations” and “Development phase” layers are activated for the start date (April 1 of the respective year). The legends are shown for all layers.
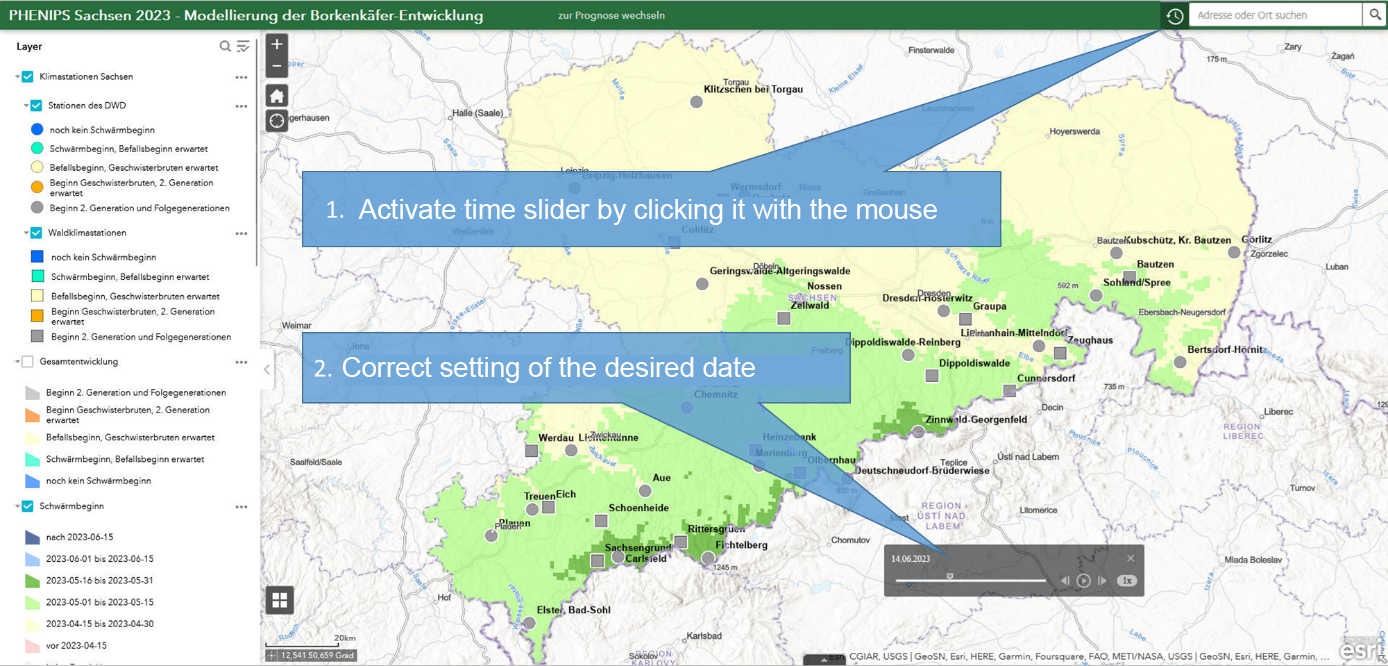
To access the daily updated map displays, it is necessary to click on the time symbol in the title bar of the map service. This opens a window with a time slider. The two time sliders must be moved over each other with the mouse (for correct display and quick loading of the selected map) and the desired date can then be set or an animation started using the arrow keys or the mouse (see also below).
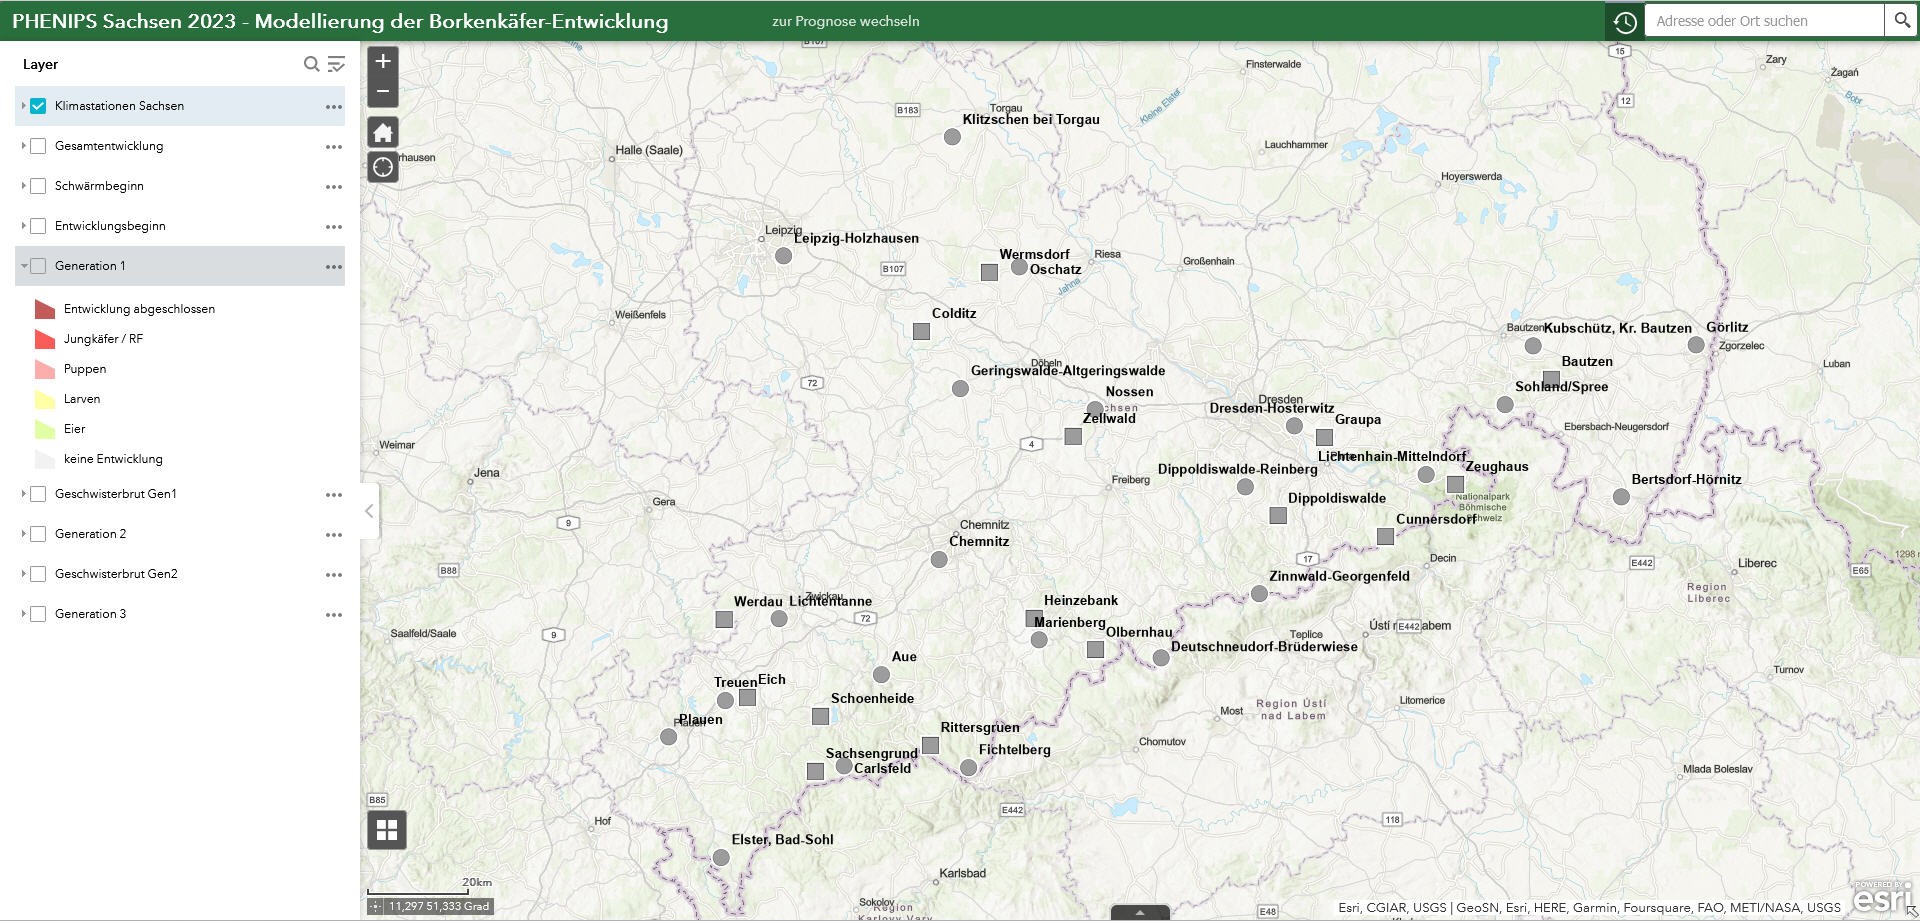
The following data layers can be displayed by clicking on the respective checkbox in the layer list:
DWD climate stations and forest climate stations in Saxony (position and name of the station)
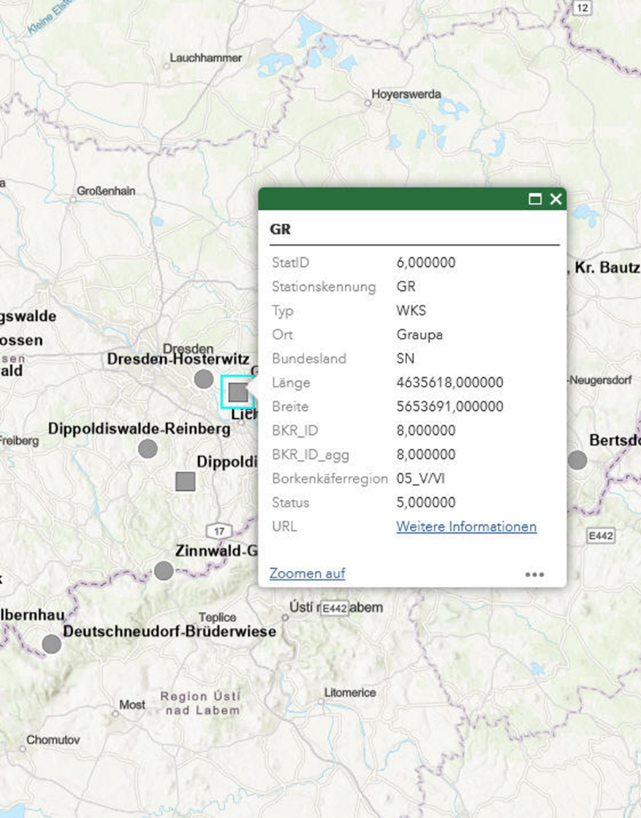
Clicking on the station symbol on the map (left mouse button) opens a window with more detailed information on the station.
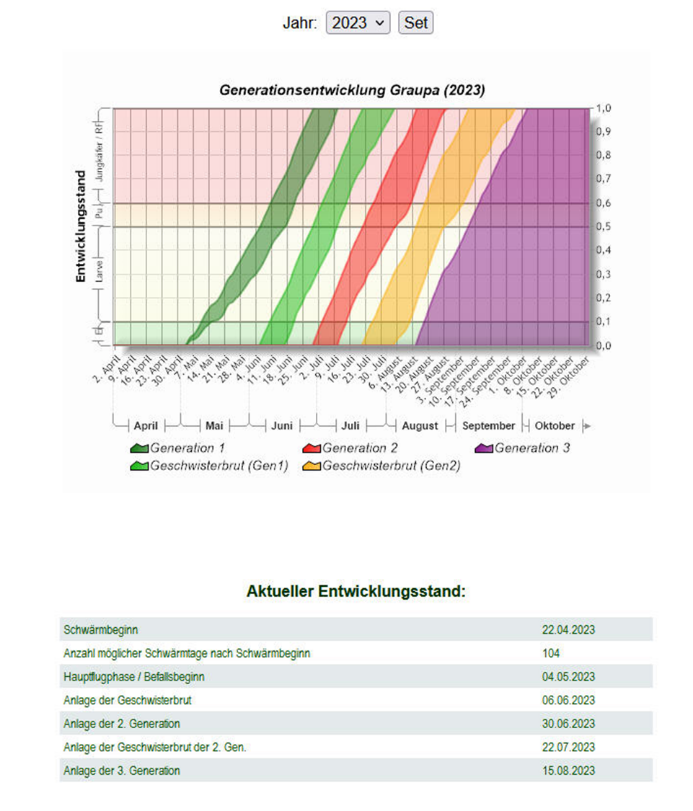
By clicking (left mouse button) on the URL: Further information, you can access a detailed display of the current development status (temperature sum curve and the tabular list of development times) for the selected station.
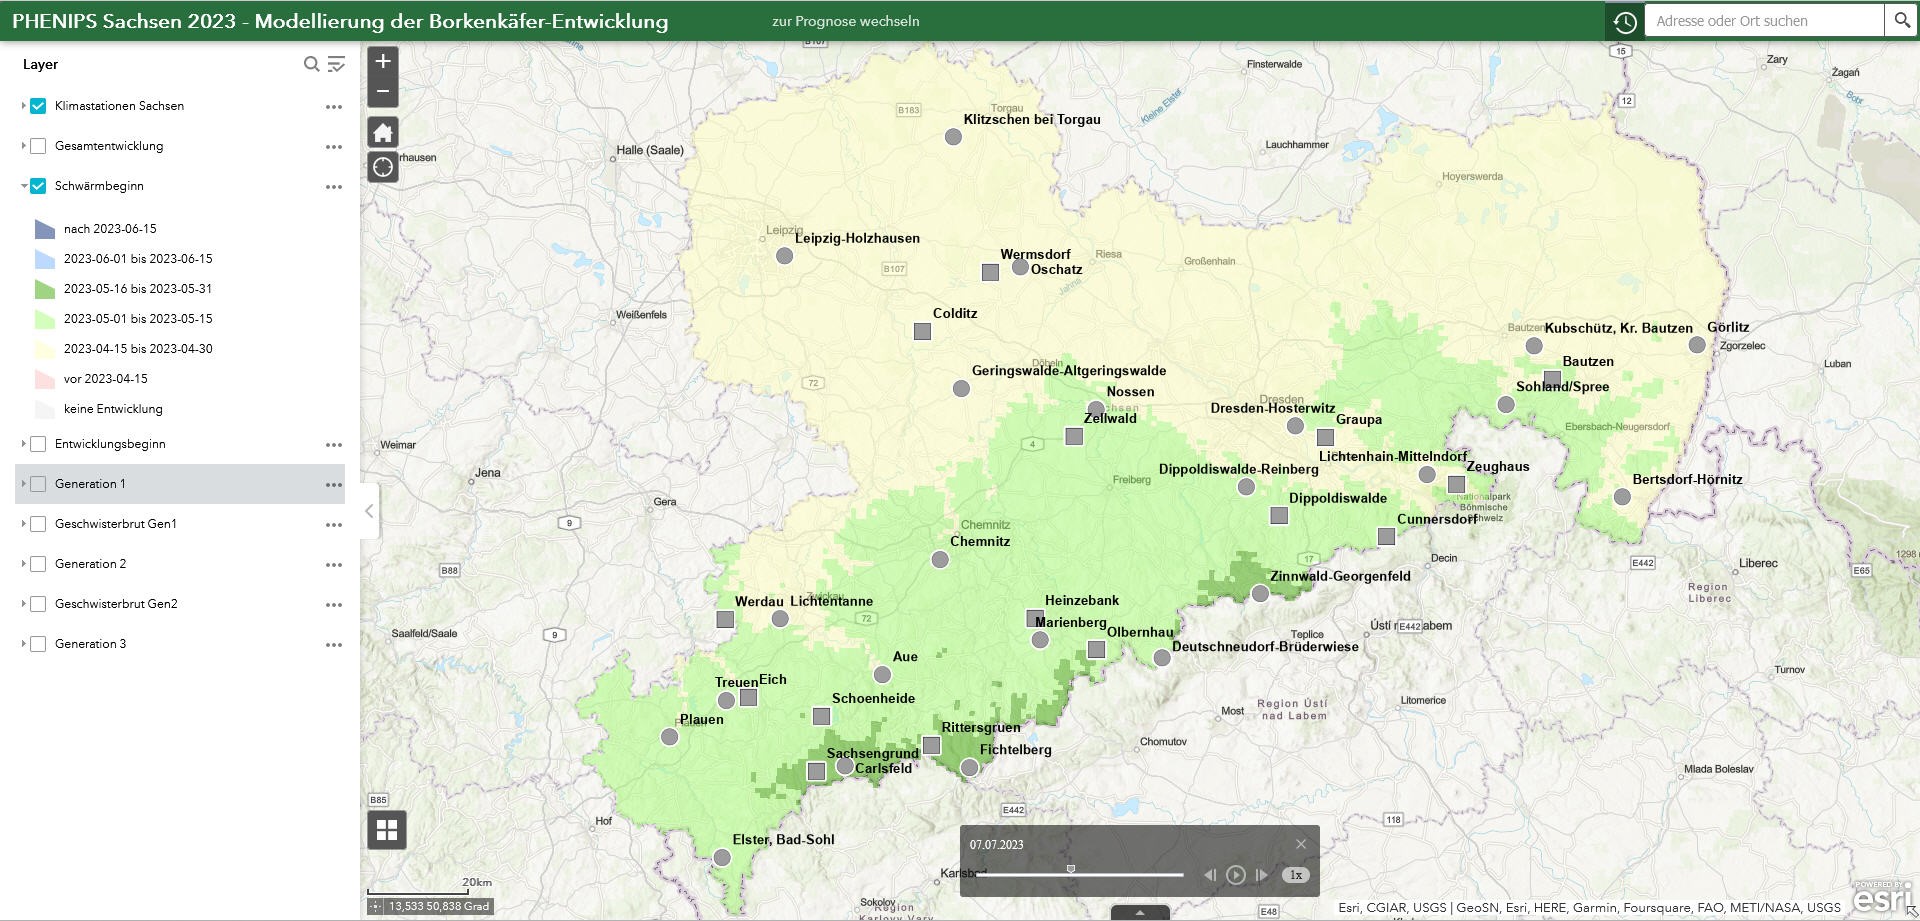
Onset of spring swarming (earliest onset of swarming activity from April, classified)
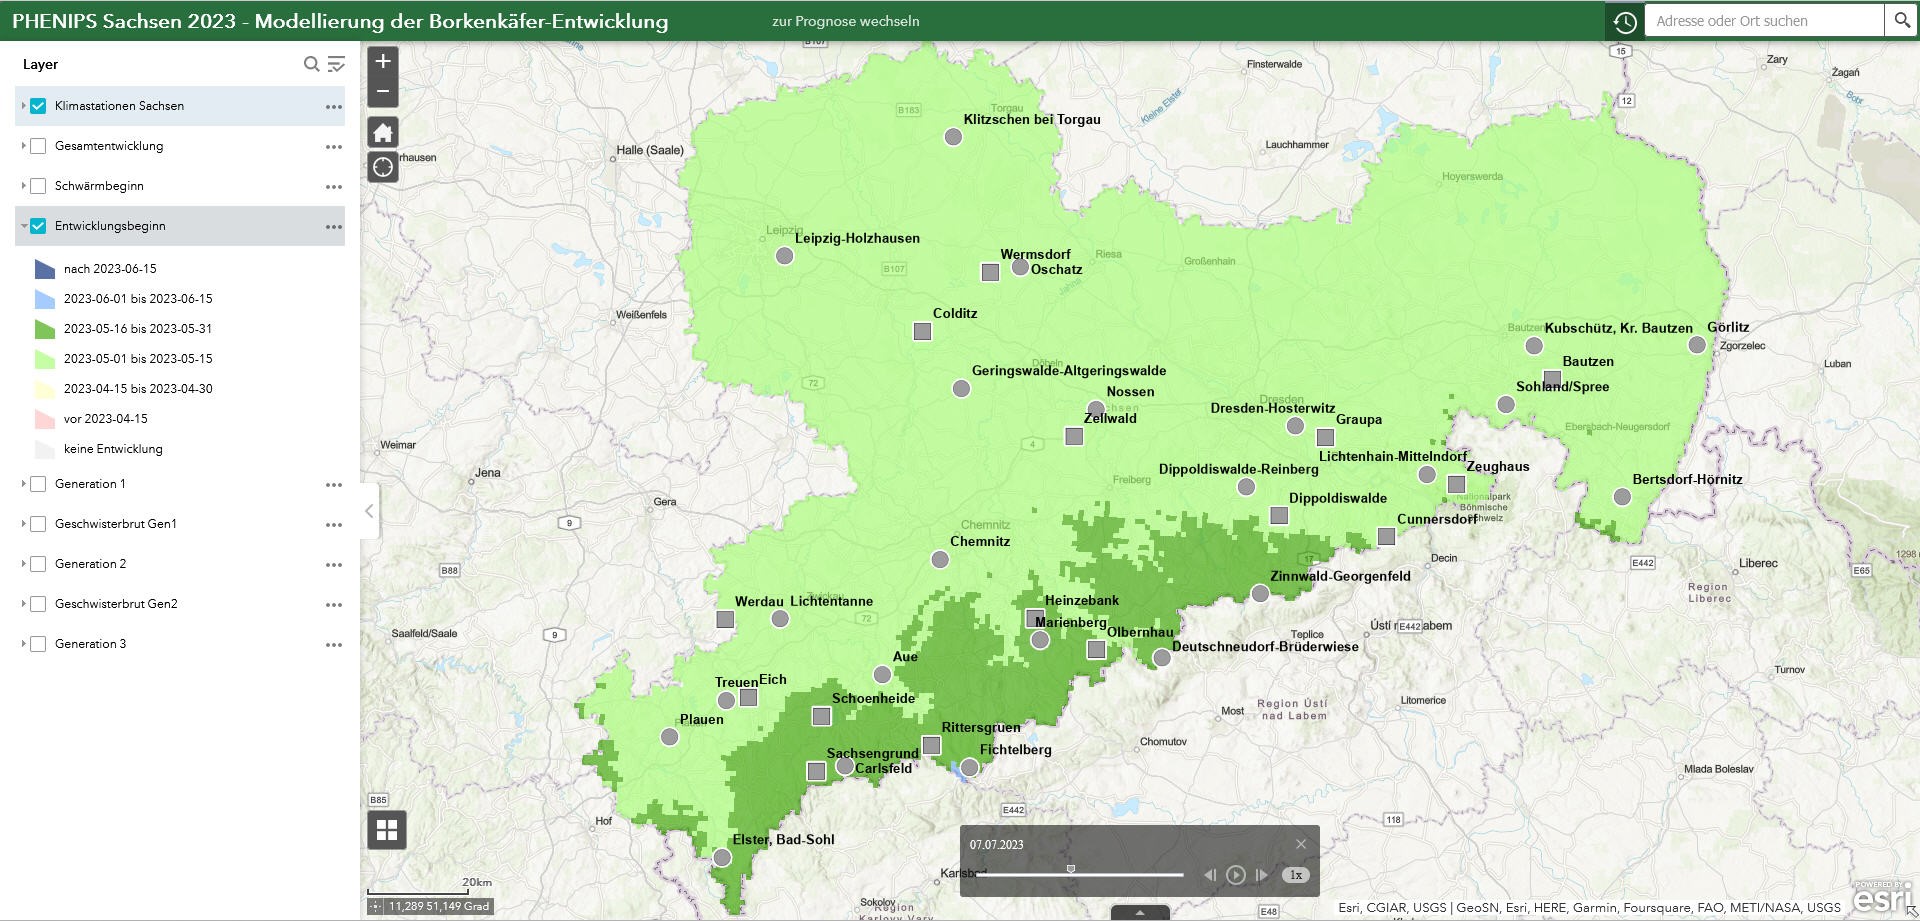
Start of development (start of the first main swarming phase in spring (start of infestation) or start of the first generation, classified).
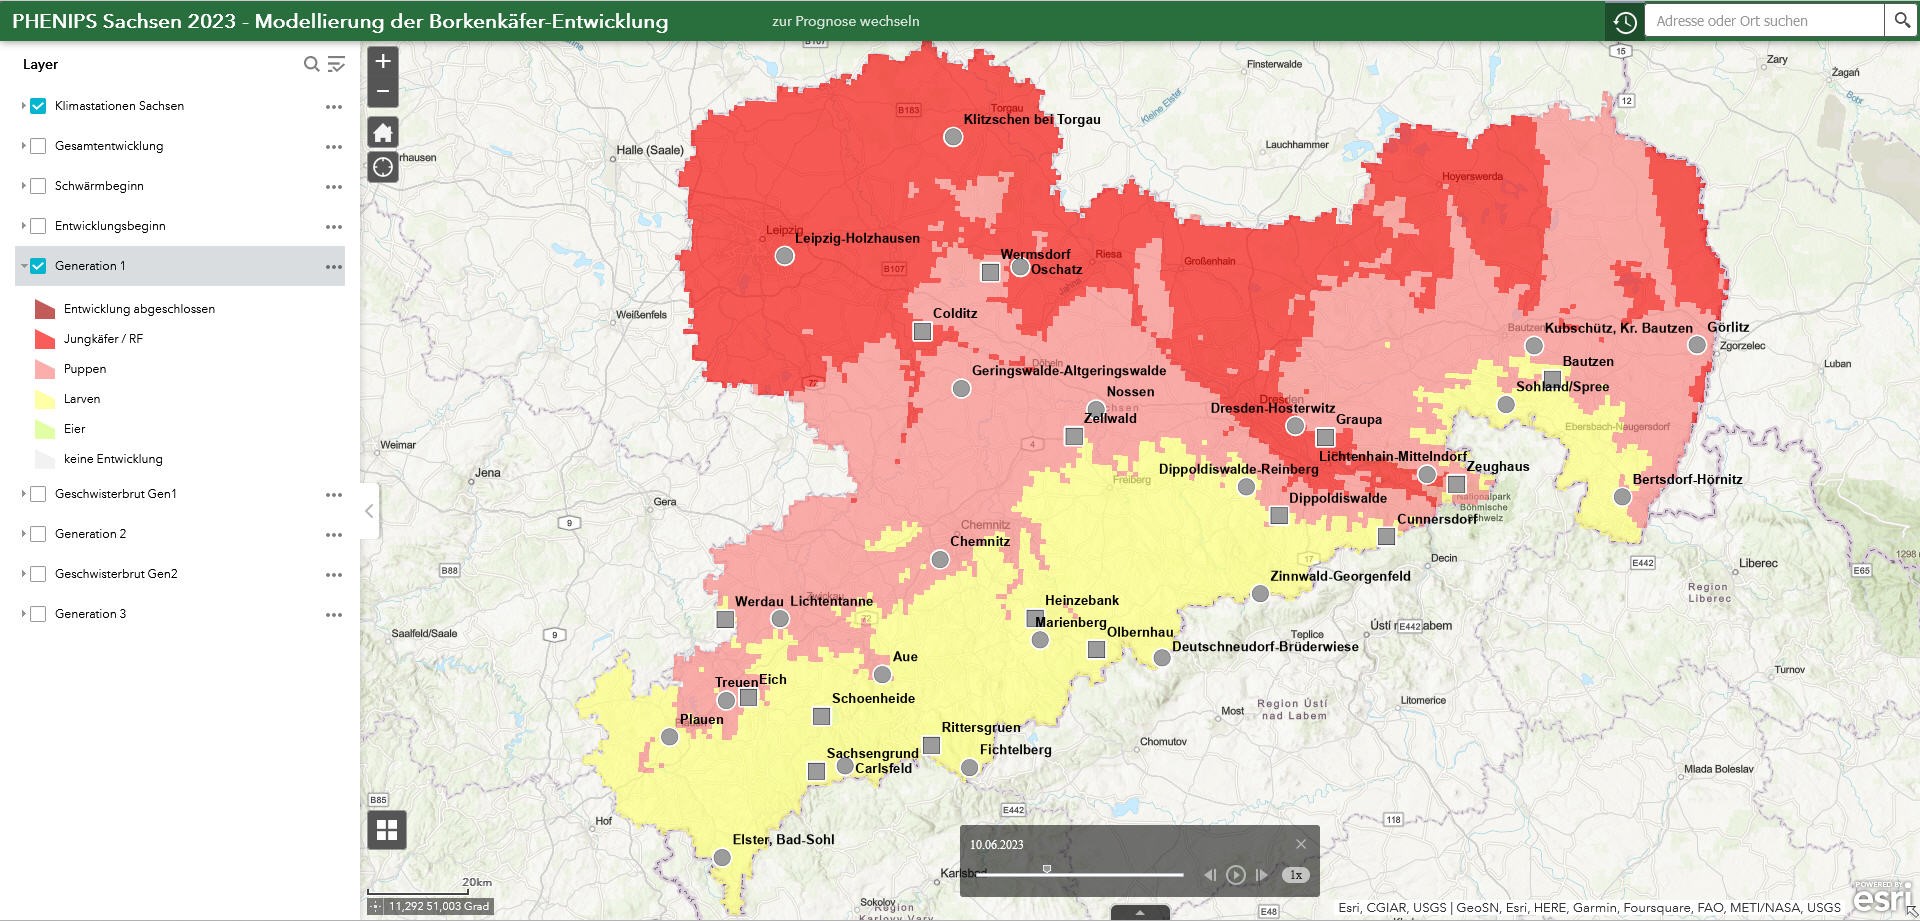
Progress of development of the respective generation of the spruce bark beetle and the sibling broods (maximum possible developmental stage in each case, separated by developmental stage).
Development phase: phenological phases of spruce development and expected further development, color-coded with information on necessary forest protection measures.
The table with recommendations for action depending on the development phase is available at https://ifff-server1.boku.ac.at/BKR_Sachsen/Masznahmen.htm.
Controlling the display of the map layers: The legend can be shown or hidden for all layers by clicking on the layer name. By default, all legends are shown when the map service is started and the “Climate stations” and “Development phase” layers are activated for the date April 1.
By clicking on the symbol ![]() , all legends can be shown or hidden and all data layers can be activated or deactivated at once.
, all legends can be shown or hidden and all data layers can be activated or deactivated at once.
By clicking on the symbol ![]() , you can change the layer properties transparency, enable the pop-up window of the layer and zoom to the maximum extent of the layer.
, you can change the layer properties transparency, enable the pop-up window of the layer and zoom to the maximum extent of the layer.
The zoom setting of the map can be changed with the symbol ![]() . You can also use the mouse pad or mouse to zoom in and out of the map and move the map section.
. You can also use the mouse pad or mouse to zoom in and out of the map and move the map section.
Click on the symbol ![]() to return to the standard extent of the map section.
to return to the standard extent of the map section.
Entering a location or address in the search field ![]() a pop-up window with the search result and zoom in on it.
a pop-up window with the search result and zoom in on it.
Different base maps can be selected by clicking the ![]() icon.
icon.
Activating the time slider tool![]() in the title bar allows you to display the time history or a specific point in time of the selected layer.
in the title bar allows you to display the time history or a specific point in time of the selected layer.
A window with two time sliders and the name of the active data layer opens at the bottom of the map.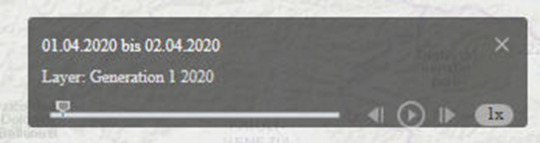
To display a single day, the two time sliders in the timeline must be moved directly over each other with the mouse so that only a specific date appears in the display window (e.g. 01.04.2020).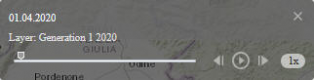
The date can then be moved as desired by clicking on the arrow symbols. By clicking on the play symbol![]() , an animation can be started for the period from the selected date or a specific time period set using the time slider.
, an animation can be started for the period from the selected date or a specific time period set using the time slider.
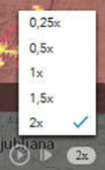
The speed of the animation is set to 1x by default and can be changed by clicking on it.