PHENIPS - Quick start guide for monitoring of bark beetle development
The spatial representation of phenology and development of I. typographus, derived from raster based weather data (INCA layers from ZAMG Austria), are provided as web map services for the season 2021 to 2023. For the latter the current development as well as a forecast for 28 days is available. The calculations of the forecast are based on daily means of the last ten years.
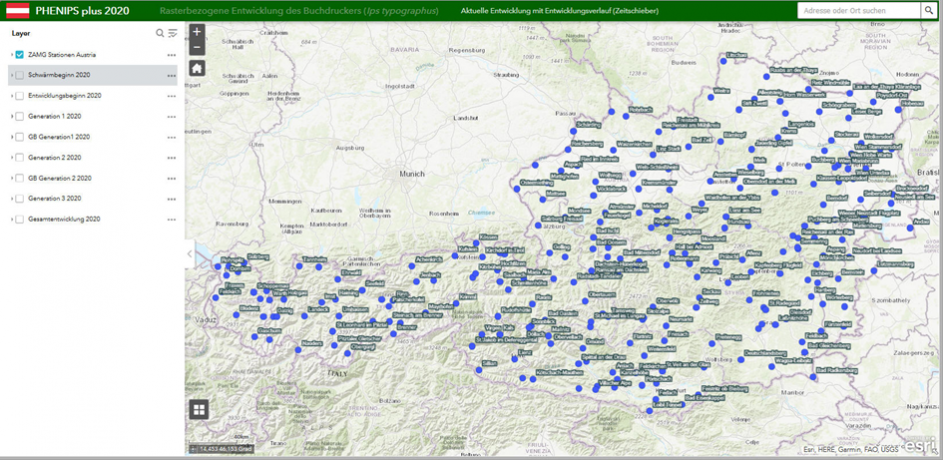
Map-Services
Retrieving the current map service the development starting at April 1 up to the previous day is shown by default. With the link „switch to forecast“ in the header of the application there can be switched to the service with the forecast for the coming 28 days. The left column of the app contains the layer list and the respective legends. This layer list can be hidden respectively shown by pressing the button ![]() .
.
Following layers are available and may be switched on and off:
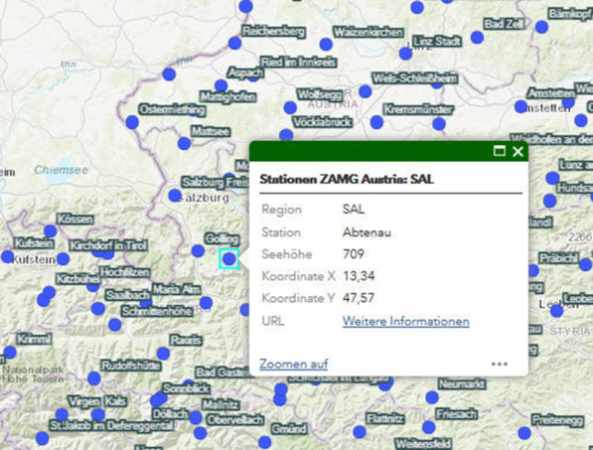
• Weather stations
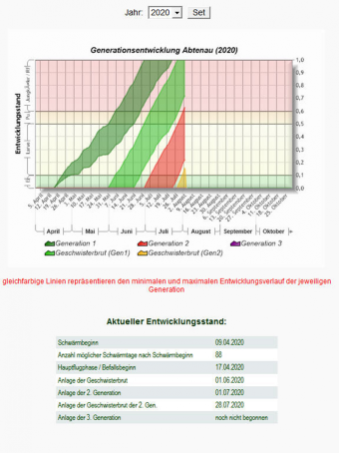
If selecting a station symbol in the map, a pop-up shows details of it. Retrieving the link „URL: weitere Informationen“ attains a chart with detailed information on the development and a tabulation of different development dates is displayed for the respective station.
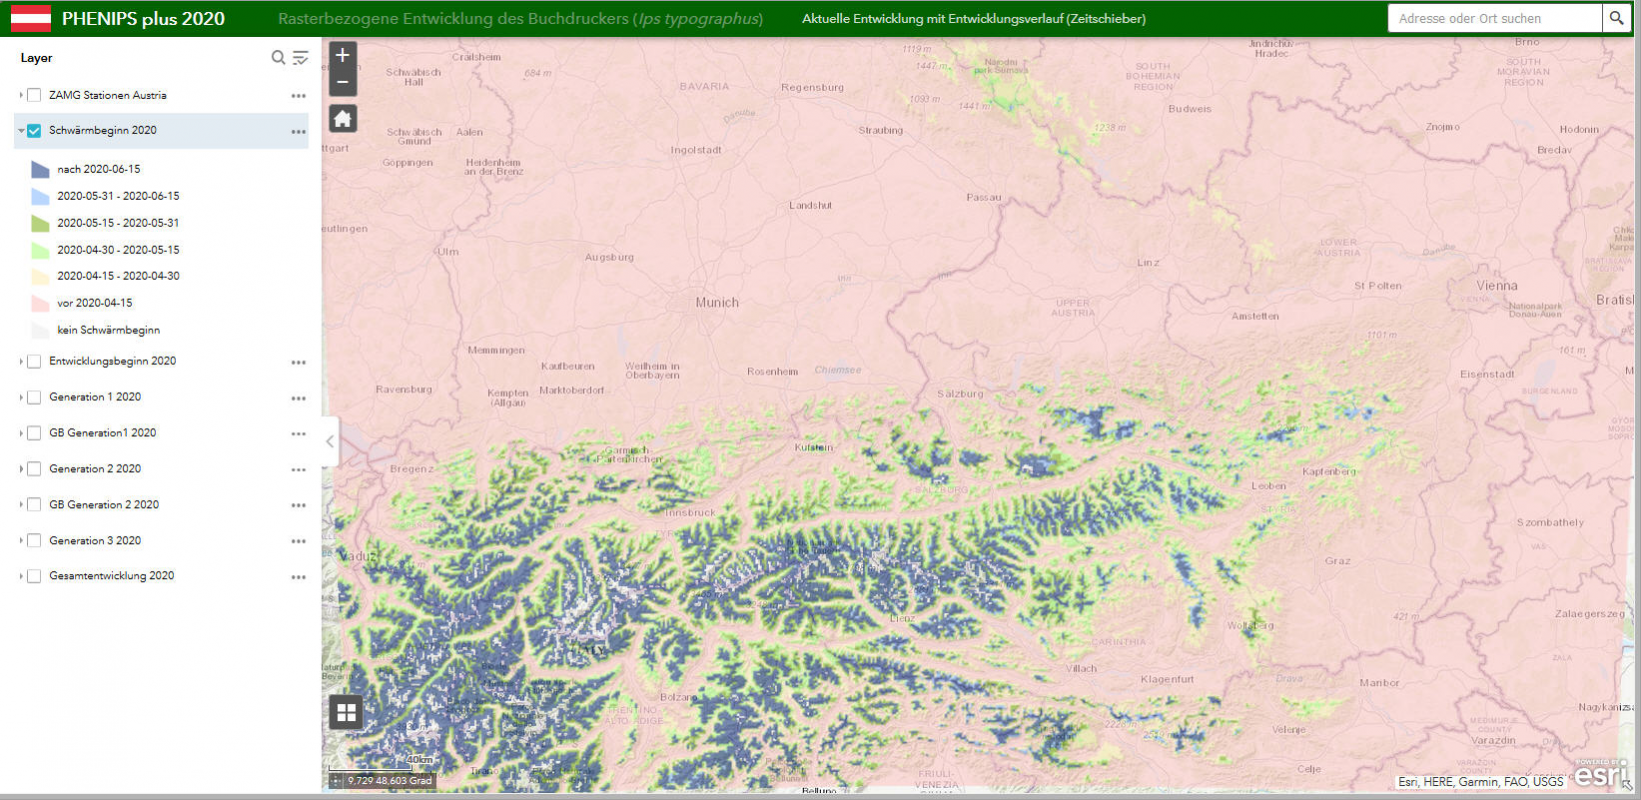
• Onset of swarming (earliest start of activity, classified).
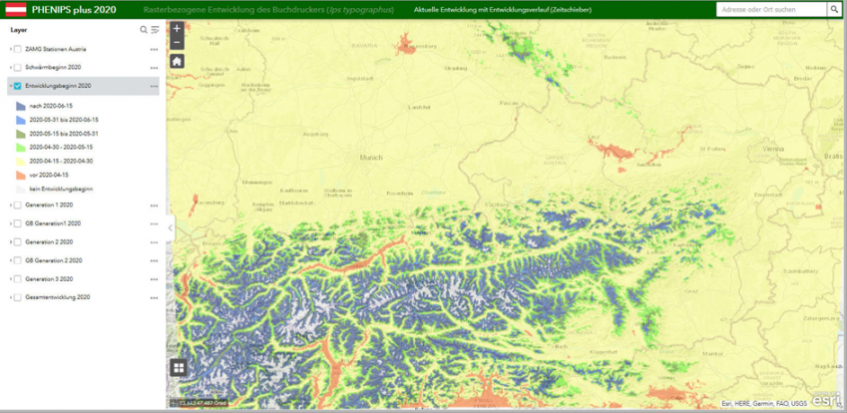
• Onset of host tree infestation (main activity of swarming in spring resp. onset of first generation).
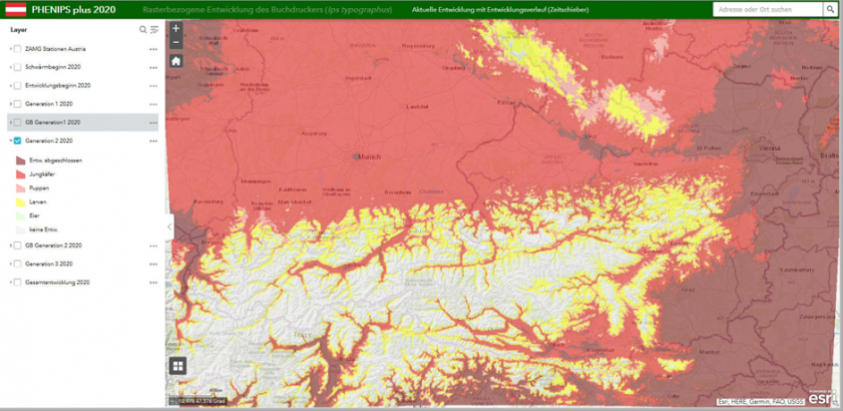
• Progress of development of the respective generation or sister brood (sb) (earliest possible developmental stage).
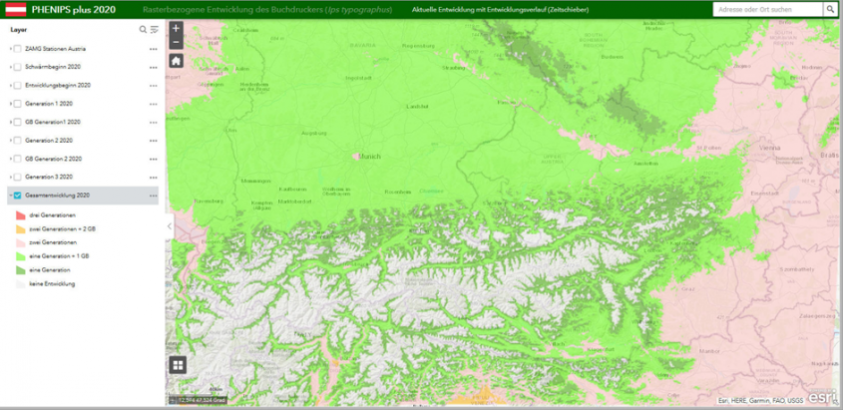
•Total development (number of current finished generations).
By default all layers are expanded and the layers „weather stations“ and „spring swarming“ are turned on and can be collapsed resp. turned off by the buttons left of the layer name.
Pressing the button ![]() all layers can be turned on/off or expanded/collapsed at once.
all layers can be turned on/off or expanded/collapsed at once.
Pressing the button ![]() the layer transparency can be changed, the pop-up of the layer may enabled and zooming to the maximum extent of the layer can be done.
the layer transparency can be changed, the pop-up of the layer may enabled and zooming to the maximum extent of the layer can be done.
Pressing the button ![]() the zoom of the map can be changed. Zooming also can be done by using the mouse wheel, and panning the map by the left mouse button.
the zoom of the map can be changed. Zooming also can be done by using the mouse wheel, and panning the map by the left mouse button.
Pressing the button ![]() zooms to the default extent of the map.
zooms to the default extent of the map.
Entering an address or locality into the search tool ![]() opens a pop-up with the search result and zooms to it.
opens a pop-up with the search result and zooms to it.
Pressing the button ![]() allows to choose a different base map.
allows to choose a different base map.
The Time Slider widget enables to view temporal layers in a map and play the animation to see how the data changes over time. Clicking the icon ![]() opens the widget panel with the name of the active layer and two time sliders.
opens the widget panel with the name of the active layer and two time sliders.
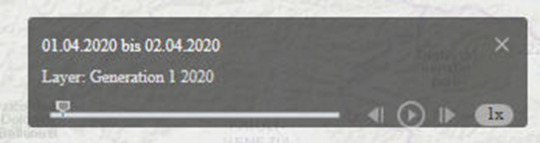
To show the data of a single day, both sliders have to be placed about each other that only the desired date appears in the panel (e.g. 01.04.2020).
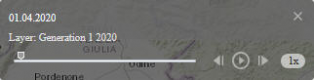
Moving both sliders together allows sliding to any date.
Clicking the play icon ![]() starts an animation beginning with a chosen single date or a selected time span between the two sliders.
starts an animation beginning with a chosen single date or a selected time span between the two sliders.
The speed of the animation is set to 1x by default 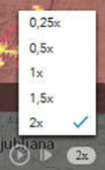 and may be changed by clicking it.