PHENIPS-TDEF – linking transpiration deficits due to drought episodes to bark beetle development
Empirical background of PHENIPS-TDEF
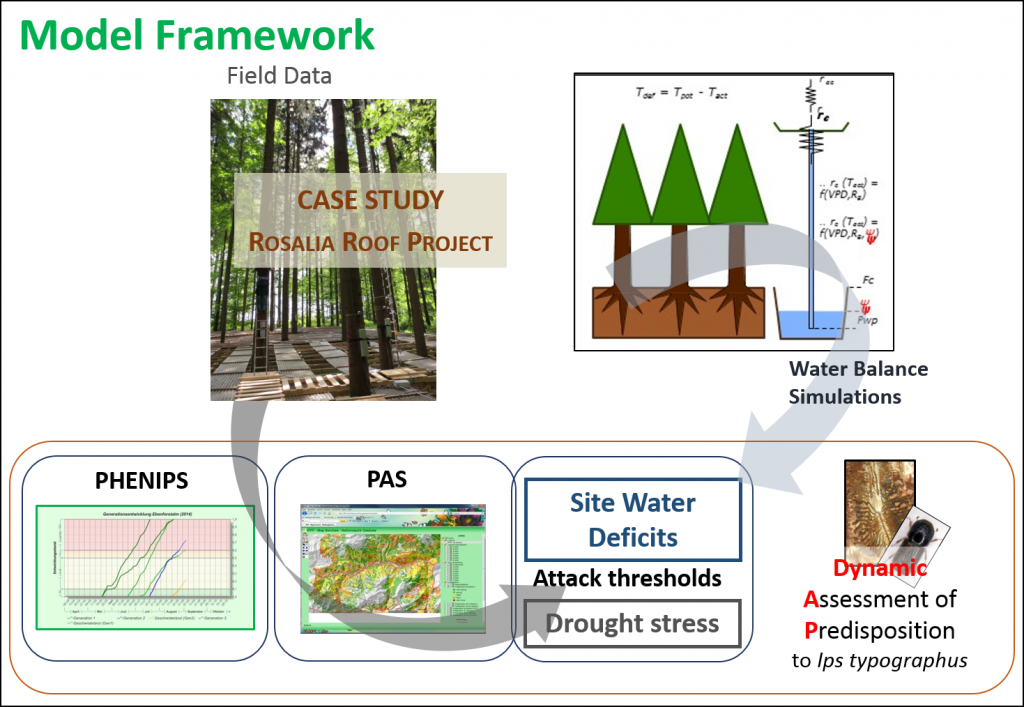
The dual “bark beetle phenology – forest water balance” model is an extension of the original PHENIPS model (Baier et al., 2007) by a simple ecosystem water balance module (TDEF) developed upon climatic and meteorological measurements in the course of the drought manipulation Rosalia Roof experiment (Netherer et al., 2015). This in situ study was initiated to improve the mechanistic understanding of I. typographus infestations, allowing for the complementation of a model framework (Fig.1). The main study goals were to clarify how attack of mature Norway spruce by I. typographus is affected by tree drought stress, and to quickly translate novel study results into practical applications for risk assessment.
Case study - results
As demonstrated by Netherer et al. (2015), seasonal variations in the stress status of individual trees influenced the ratios of successful attacks and attacking bark beetles repelled by the trees. In particular, defence capability of the spruce trees decreased with increasingly negative twig water potentials and decreasing resin flow rates. In a next step, resistance of study trees against attack was linked to soil water limitations at the plots, which caused a reduction in potential transpiration. To estimate transpiration deficits of trees at the study site, sap flow measurements were combined with simulations from a simple forest water balance module calibrated upon hydrological and meteorological data recorded at the site.
The acute and chronic transpiration deficits found at the Rosalia study site to a certain degree explained bark beetle boring success. Trees accumulating transpiration deficits from May to September 2012 and again from May to mid-July 2013 could only defend against <10% of the early season I. typographus attack attempts, while control trees (experiencing almost zero transpiration deficits in 2012 and spring 2013, respectively) defended >70% of attacks. Later in the season, the proportions of successful and defended attacks did not differ any more significantly between trees depleted from rainfall by rain-out shelters and control trees. From mid-July to end of September 2013 both variants experienced distinct drought stress, yet, boring success of beetles was generally lower than 50%. Similar attack rates of the variants might be due to acute drought stress of the control trees in response to the dry and hot weather conditions of the later season that impaired defence capability compared to conditions in spring and early summer. Furthermore, in response to the higher temperatures in mid-summer, resin flow rates were also high for the sheltered trees, increasing their resistance to single boring attempts.
The water balance module TDEF
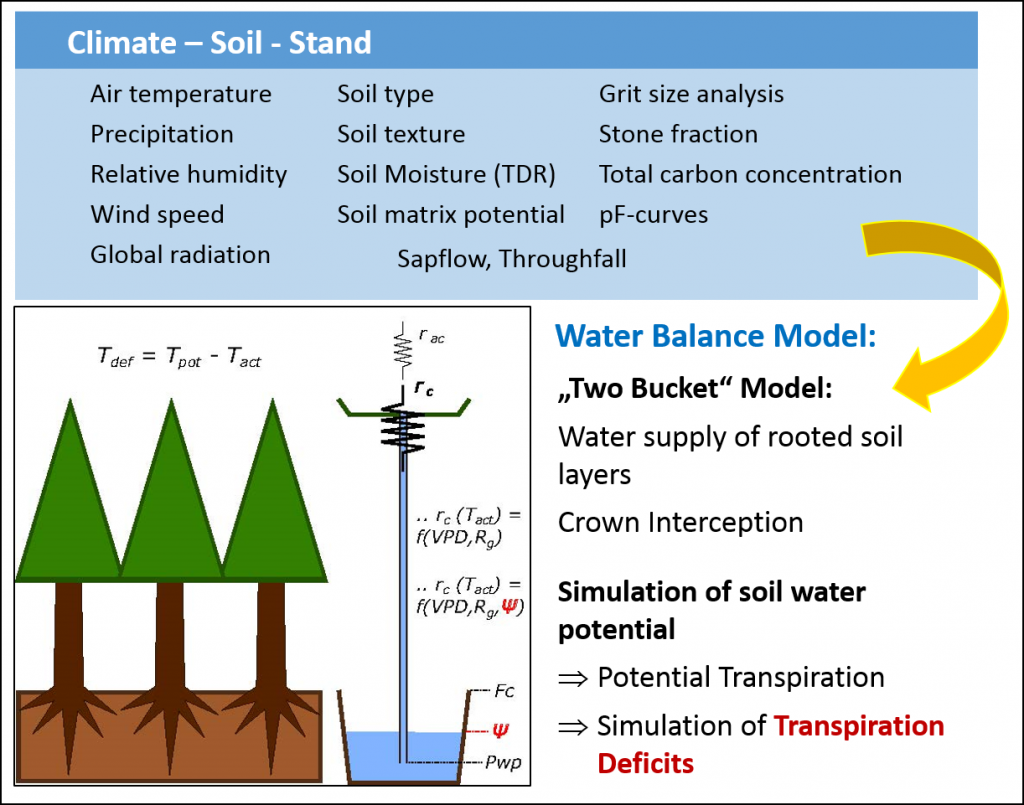
Stand hydrology is basically described by a canopy reservoir, whose storage capacity is determined by the leaf area index (LAI) and the interception capacity per unit LAI, and a soil reservoir, where storage capacity depends on the rooting depth and soil water content at field capacity (Fig. 2). In response to measured precipitation and simulated fluxes of canopy/soil evaporation and transpiration (described by Penman Monteith equations), the water balance equations of the two reservoirs fluctuate. The difference between the potential transpiration (limited by global radiation and vapour pressure deficit) and the simulated actual transpiration (further limited by soil water potential) results in the daily transpiration deficit calculated at a daily interval (mm d-1).
Based on results of the Rosalia Roof experiment (Netherer et al., 2015; Matthews et al., under review) and earlier simulation studies (e.g. Marini et al., 2013; Temperli et al., 2013), we regard the transpiration deficit as a useful index in I. typographus risk assessment. Combining the hydrological module TDEF with the phenology model PHENIPS, such an updated bark beetle hazard rating tool is potentially capable of real time, stand level reporting of periods of stand drought stress and bark beetle flight (Fig. 3). Ongoing steps are the practical application of PHENIPS-TDEF to optimise and validate the model packages based on data gained from literature and case studies in the field for an extensive application at various site conditions. To figure out the influence of timing and intensity of drought stress periods on forest susceptibility, it is necessary to model water deficits retrospectively and compare periods of drought with past timber loss due to bark beetle attack. Incorporated into a monitoring system, PHENIPS-TDEF can support the prioritisation and scheduling of pest control in forest management, such as early detection of susceptible forest areas and infested trees.
References
Baier P., Pennerstorfer J. and Schopf A., 2007. PHENIPS—A comprehensive phenology model of Ips typographus (L.) (Col., Scolytinae) as a tool for hazard rating of bark beetle infestation. Forest Ecology and Management, 249(3): 171-186.
Marini L., Lindelöw Å., Jönsson AM., Wulff S., Schroeder LM., 2013. Population dynamics of the spruce bark beetle: a long-term study. Oikos 122: 1768-1776.
Matthews B., Netherer S., Katzensteiner K., Pennerstorfer J., Blackwell E., Henschke P., Hietz P., Rosner S., Jansson P.E., Schume H., Schopf A. (under review). Agricultural and Forest Meteorology.
Netherer S., Henschke P., Matthews B., Schopf A., 2013. Modelling Dynamic Predisposition to Attacks by the Eurasian Spruce Bark Beetle Ips typographus. A Drought Stress - Experiment: ROSALIA ROOF PROJECT, Mitt. Dtsch. Ges. allg. angew. Ent. 19: 93-96.
Netherer S., Matthews B., Katzensteiner K., Blackwell E., Henscke P., Hietz P., Pennerstorfer J., Rosner S., Kikuta S., Schume H., Schopf A., 2015. Do water-limiting conditions predispose Norway spruce to bark beetle attack? New Phytologist 205: 1128-1141.
Temperli C., Bugmann H. and Elkin C., 2013. Cross-scale interactions among bark beetles, climate change, and wind disturbances: a landscape modeling approach. Ecological Monographs, 83(3): 383-402.